Back on top: new data show wealthy recovering more than others
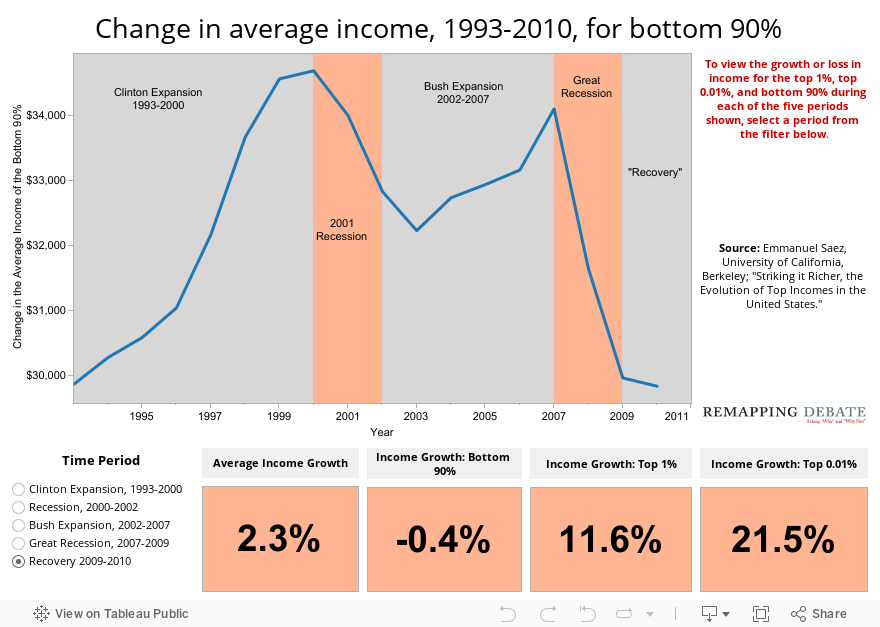
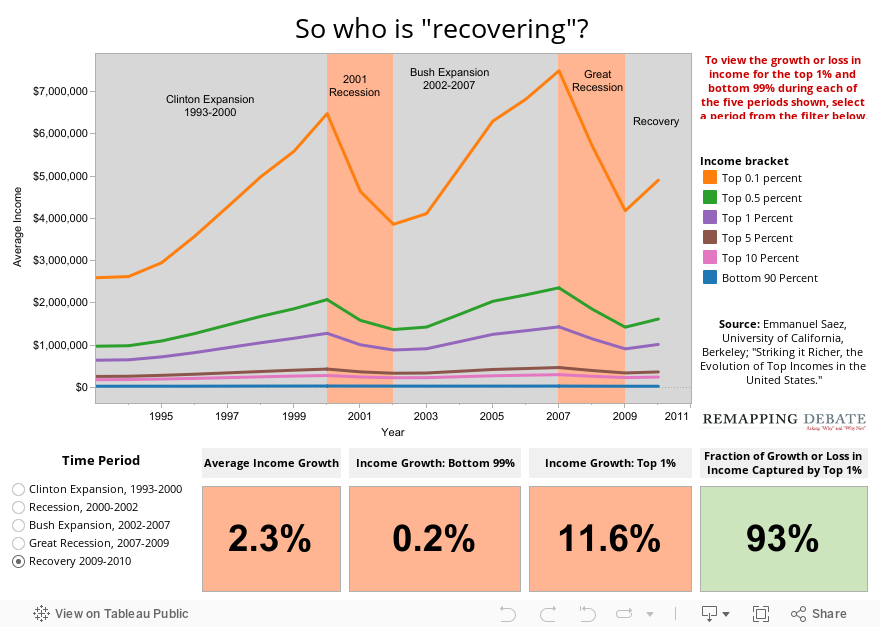
Mar. 5, 2012 — Average income of the top 1 percent of Americans, along with their share of total income, is recovering more after the Great Recession than is the case for other Americans, according to updated 2009 and 2010 data just analyzed by Emmanuel Saez of the University of California, Berkeley. The subsets of the top 1 percent — that is, the top tenth and top hundred of 1 percent — are faring better as well. The top 1 percent of families captured 93 percent of total income growth from 2009 to 2010.
Saez, along with Thomas Piketty of the Paris School of Economics, have gotten signficant attention in recent years with their analysis of Internal Revenue Service data. That analysis had demonstrated a strong trend towards greater income inequality.
We present four visualizations based on these data. On this page, in two visualizations, we track average income for various income bands starting in 1993 (at the beginning of the “Clinton Expansion”). In that expansion, the “Bush Expansion,” and in the nascent recovery period starting in 2009, the top 1 percent of families achieved disproportionately high income growth, and garnered a disproportionately high fraction of total income growth.
On the next page, we first look inside the top 10 percent’s share of total income since 1917, and then chart average income for bands ups to the top 0.1 percent back to 1917.
Because the visualization above encompasses such a wide range of income, the changes over time in average income for the bottom 90 percent cannot be seen clearly. That problem is solved with the visualization below, which charts the data for the bottom 90 percent only. It also provides data on the bottom 90 percent and top 0.01 percent in each of the recovery or recession periods.