May 25, 2011 — For many years now, the National Center for Education Statistics has overseen national measures of educational attainment in civics, mathematics, reading, science, and United States history. Remapping Debate’s new tools attempt to allow for new ways to put those data in context.
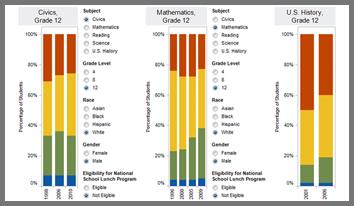
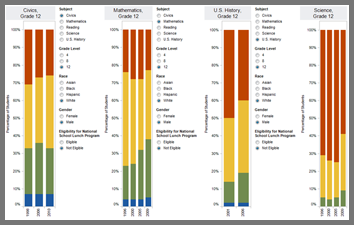
Last week, Remapping Debate presented basic and advanced versions of a data visualization on education attainment. This week, Remapping Debate enhances the advanced versions of the visualization. Whereas before the advanced versions only permitted the most recent data set in each subject to be compared, the new advanced versions provide historical data as well (going back into 1990s administrations of some tests). Comparison across time is now added to comparisons of subject, grade level, economic status, race, gender, and ethnicity.
There are many ways to compare data, but one finding is clear: though there are clear differences in group by group, subject by subject, and grade by grade performance, the percentage of students who perform at an “advanced” level is always low.
Note: Because sufficient data to be statistically significant was not always gathered by NCES for each group in each year in each subject, you may find that, in the course of changing variables, you see fewer bars of data.
This data viz has been updated on Jun. 29, 2011 to include the results of the 2010 round of testing in history.
| Our new advanced tool for resolutions of at least 1024 x 768 | Our new advanced tool for resolutions of at least 1600 x 1200 |
 |
 |