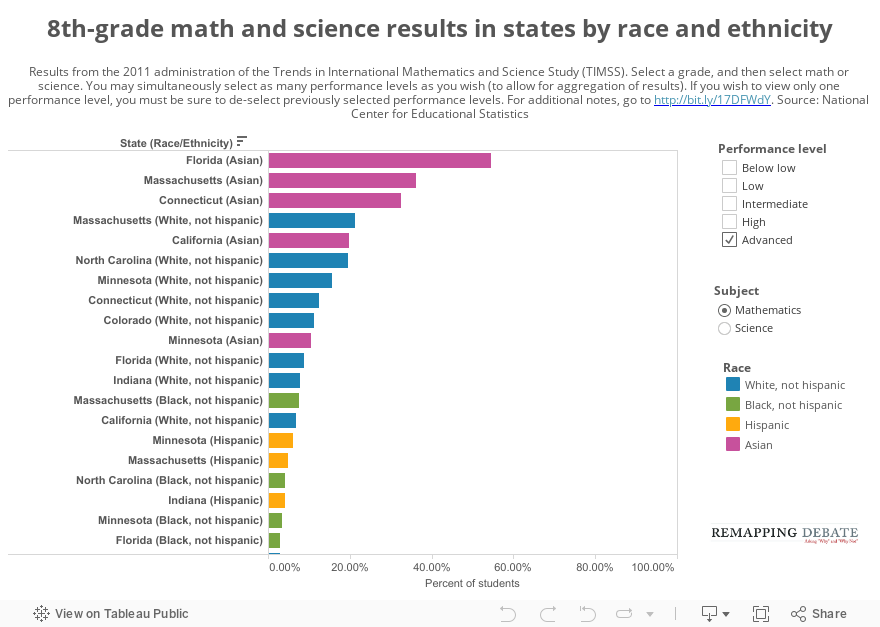
Race and ethnicity data were not available for countries other than the U.S. This visualization, therefore, looks only within the U.S. at the performance of racial and ethnic groupings, and does so at the state level. These states participated: Alabama, California, Colorado, Connecticut, Florida, Indiana, Massachusetts, Minnesota, and North Carolina (where the size of a group in a state was too small to permit statistical reliability on a state level, no data were reported). Data are available for this visualization only for eighth-grade students.
In addition to being able to compare results within one performance band, this visualization allows you to look at the aggregate result of multiple bands (for example, high and advanced). Select one or more performance levels and then select a subject.