Jan. 23, 2013 — Looking at the size of the federal workforce without taking population size into account is very misleading. Yes, 110 workers are more than 100, but if those 110 workers are serving 5,000 citizens instead of 1,000 citizens, the effective size of government employment has declined. Putting employment numbers in context is particularly important because of the common assumption that the federal workforce is much larger than it was a few decades ago. In fact, the contextualized picture shows that executive branch civilian employment is substantially down as compared with its peak in 1978. This data viz updates one we originally published in 2011.
Procedure:
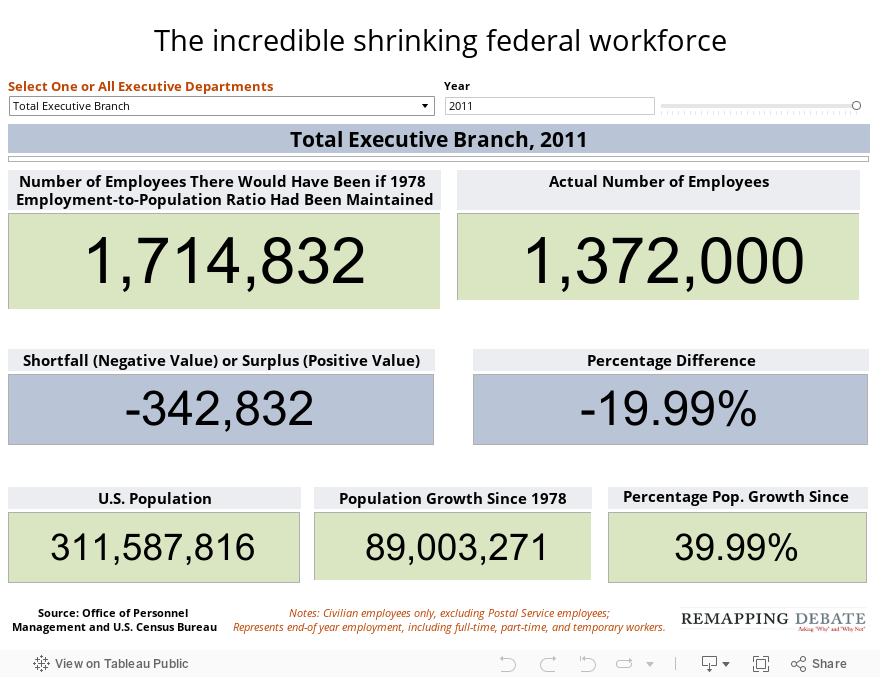
We first compared federal executive branch civilian employment in each year after the end of World War II with the population for the United States in that year. Highest employment in relation to population occurs when there are most federal workers for each American, or, to put it another way, when there are the fewest Americans per federal worker. After calculating the population to employment ratio for federal executive branch civilian employment as a whole, we saw that the employment peak in these terms was 1978. We then also calculated the population to employment ratio for that year for each agency or agency grouping where data were available from the Office of Personnel Management (OPM).
We then asked the questions: if the ratio had been maintained, what would the number of employees have been in each year since 1978, and how does that alternative path compare to the actual personnel patterns that transpired? In the visualization below, the drop-down window allows you to select total federal civilian employment or select a particular agency or agency grouping. The slider allows you to observe change over time. On the next page, what is visualized is the changing population to employment ratio itself (with the lowest ratio representing most robust employment).
OPM assigns employees to agencies or agency groups so that there is comparability over time (that way, for example, civilian employees with the functions now performed by the Department of Homeland Security are reported in the Homeland Security category even prior to the creation of that department). It turns out that overall executive branch federal civilian employment is effectively down quite substantially from the 1978 peak as defined above. In terms of the categories of agencies delineated by OPM, all are likewise substantially down, with the exception of Department of Homeland Security and the Department of Justice. Employment is not, however, at its lowest point; the levels are generally higher than they were a few years ago.
Note: the visualization is not designed to capture the phenomenon of increasing federal spending on contractors to do work that would otherwise be performed by federal civilian employees. Additional note.
The primary gatherer of data for the original viz was Margaret Moslander.