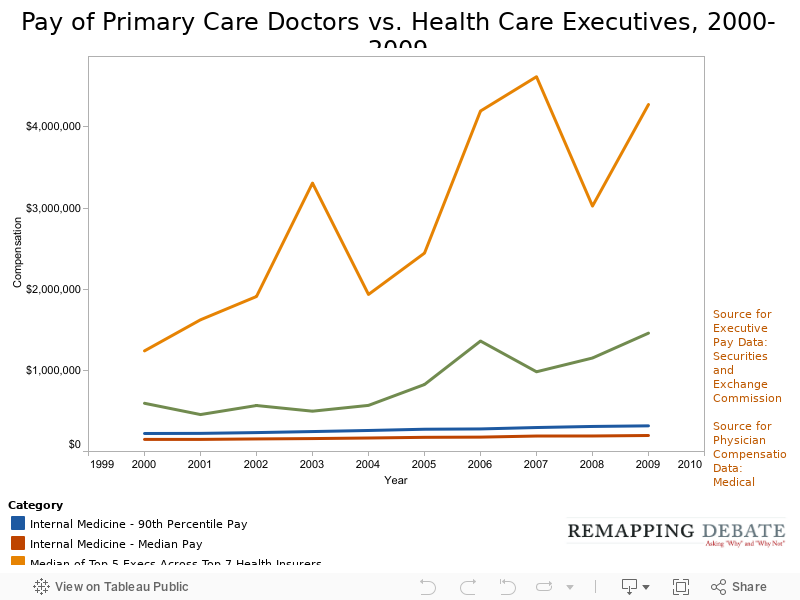
December 7, 2010 — Even relatively high paid family practitioners and internists earn much less money than health insurance executives, and the gap has been growing over time.
The first graph below shows what internists at the 90th percentile of pay earned each year from 2000 to 2009 (that is, of every 100 internists, 90 earn less than what is shown on the chart). Family practitioners earn modestly less.
Also depicted are the earnings for the five highest paid executives in the seven largest health insurance companies. The green line represents the lowest paid of each of those executives each year, and the orange line represents the median compensation for all of those executives (that is, half earned more, and half less).
The gaps were already substantial in 2000 (with the lowest paid of the insurance executives listed earning 167 percent more than the high earning internist). In 2009, the gap had more than doubled, to 361 percent.
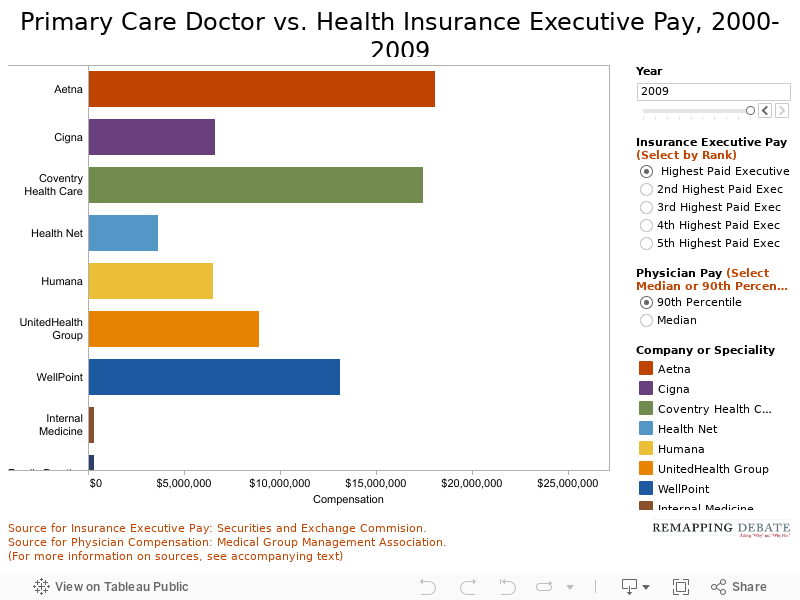
The next graph provides both internist and family practitioner data, and provides more per company information and more detail on each executive pay rank.
Use the slider in the upper right-hand corner of the graph to scroll through the years and view change over time. You must also choose whether to view the annual compensation of the highest paid executive (usually the CEO, President or Chairman), or that of any of the other four highest paid executives, by selecting a ranking in the “Insurance Executive Pay” box on the right.
Beneath the “Insurance Executive Pay” box is the “Physician Pay” box, where you can choose to see the annual compensation of doctors in either the 90th percentile or the 50th percentile (median) for internists and family practitioners.
Data Notes:
The data on Executive Compensation comes directly from the Definitive Proxy Statements filed by each company for each year with the Securities and Exchange Commission. When available, the number listed represents total compensation; when total compensation was not listed (before 2005), the figures represent the total of base salaries, bonuses, payouts from stock options, and other compensation listed by the company. The health insurance companies shown here are the top seven publically traded companies in the industry, by total revenues, as ranked in the Fortune 500.
The data on Physician Compensation was provided by the Medical Group Management Association. In an annual survey of physicians and hospitals, the MGMA collects information on more than 40,000 physicians, approximately half of whom work in private or physician-owned practice. In this graph, the user can chose to see the compensation of physicians in either the 90th percentile or the 50th percentile (median) of the group surveyed.