Note: the data visualization is displayed at the bottom of this page.
Dec. 21, 2011 — Building construction is often accompanied by great fanfare. The announcement of a project, the breaking of ground, the laying of the foundation, and the final completion of the job all generate enthusiasm and excitement when the project is seen as useful and needed for the neighborhood. But over time, even as the completed project lives on in the community, it in some sense disappears from the active consciousness of the community. For those who were around when it was constructed, it ceases to be new or novel; for the generations that follow, it has always been there.
HISTORICAL PHOTOS OF SOME MAJOR PWA-ASSISTED PROJECTS IN NYC
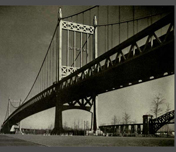
Selections from the federal government’s 1939 “Public Buildings” volume, with data on cost added.
The Public Works Administration was one of the signature projects of the New Deal. Through appropriations and bonding authority, the PWA, in the period from 1933 to 1939, financed the construction of 34,508 projects with an estimated cost of over $6 billion, according to “America Builds: The Record of PWA,” a 1939 federal government publication documenting the effort. That level of support translates to close to $100 billion when adjusted for inflation to 2011 dollars.
These investments don’t include projects financed by the Works Progress Administration, which had an initial appropriation of almost $5 billion (or approximately $80 billion in today’s terms), and, as described in Jason Scott Smith’s Building New Deal Liberalism: The Political Economy of Public Works, 1933-1956, built “an impressive range of projects including over 480 airports, 78,000 bridges, and nearly 40,000 public buildings.” (In the New York City area, the construction of LaGuardia Airport and of Midwood High School were part of this effort.)
photos of some of the nyc schools constructed with pwa-assistance

The images come primarily from the New York City Department of Education; we annotate with cost data.
As Smith points out, “On average, between 1933 and 1939 over two-thirds of federal emergency expenditures went toward funding public works programs”; these dollars “represented an increase in federal construction spending of 1,650 percent over the four years that preceded the Depression…” He writes that the distinction between PWA and WPA projects is “unwarranted,” arguing that the distinction neglects the fact that “both efforts produced substantial infrastructure throughout the nation.”
In view of the massive scope of creating a comprehensive data base, however, Remapping Debate decided to limit our data collection to projects (other than buildings that were constructed for the use of federal government) that were completed with PWA assistance in New York State. New York, it should be said, was a particularly large recipient of PWA funds. To do this, we had to go to the National Archives to find the relevant publications — created at the end of the PWA period — that documented the projects (see note below).
We include as well two photo essays illustrating PWA construction in New York City. Accessible by clicking on the boxes above, one shows a selection of schools constructed in New York City with PWA assistance (these are primarily modern-day photos). The other photo essay consists of historical photos of a variety of PWA-assisted projects in New York City.
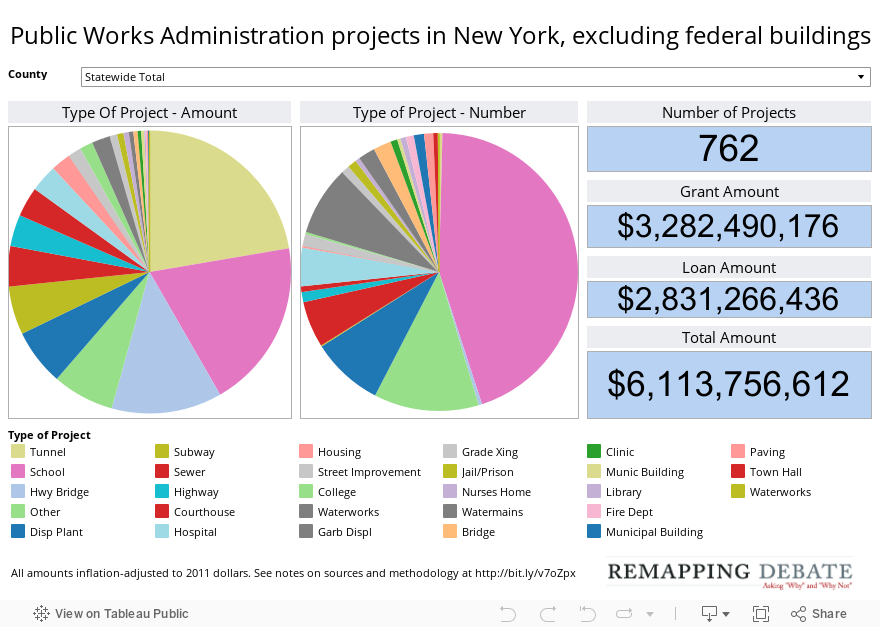
The data visualization initially displays all projects of all types throughout the state. The dropdown menu allows you to select a particular county or grouping of counties (such as New York City) to view. The visualization shows both the costs of projects (adjusted for inflation to today’s dollars) and the types of projects (schools, hospitals, etc.). Selecting the type of project in the pie charts or in the key below the pie charts visually highlights that type of project’s portion of costs as well as its relation to the total number of projects in the selected geographic area (reclick on the selected area to exit the highlighted view) .
Note on sources and methodology: Data for the visualization was taken from federal government publications obtained from the National Archives in College Park, Md., specifically:
“N.I.R.A. Allotments: Non-federal projects allotted (by counties) under National Industrial Recovery Act and the Emergency Appropriation Act through Date of May 16, 1939”
“E.R.A. ’35 and E.R.A. ’35 Suppl. Allotments: Non-federal projects allotted (by counties) under Emergency Relief Act of 1935 through date of May 16, 1939”
“P.W.A.A. ’38 Allotments: Non-federal projects allotted (by counties) under the Public Works Administration Appropriation Act of 1938 through date of May 16, 1939”
“P.W.A.E. ’37 Allotments: Non-federal projects allotted (by counties) under the Public Works Administration Extension Act of 1937 through date of May 16, 1939”
“F.D.A. ’35 Allotments: Non-federal projects allotted (by counties) under the First Deficiency Appropriation Act, Fiscal Year 1936, through date of May 16, 1939”
Inflation adjustment was calculated based on the year that the bill under which funding was received had been passed.