1
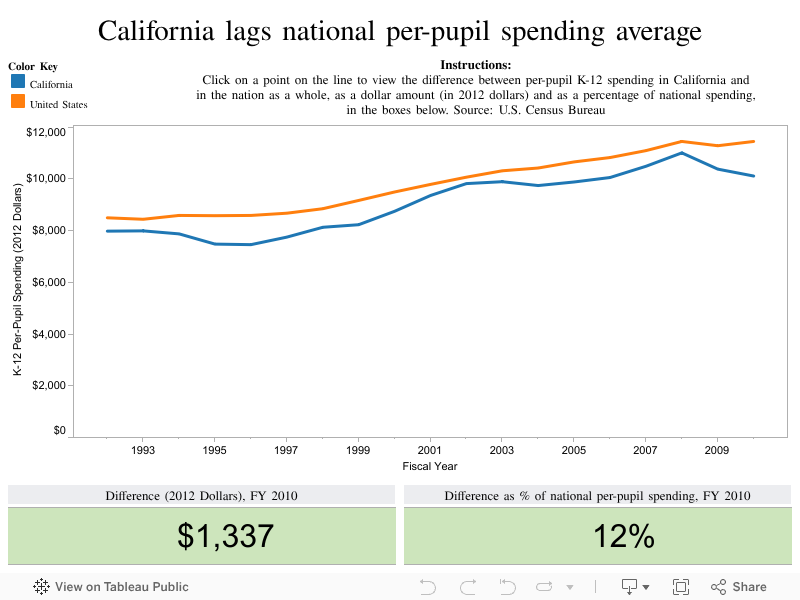
This visualization compares per-pupil spending on primary and secondary education in California with the national average for fiscal years 1992 through 2010. All spending figures are inflation-adjusted to 2012 dollars.
Note that in the past decade, the two figures were closest in 2008 but have been diverging ever since, with U.S. spending increasing since 2009 while California spending has been decreasing. California spent less per student in 2010 than in 2007.