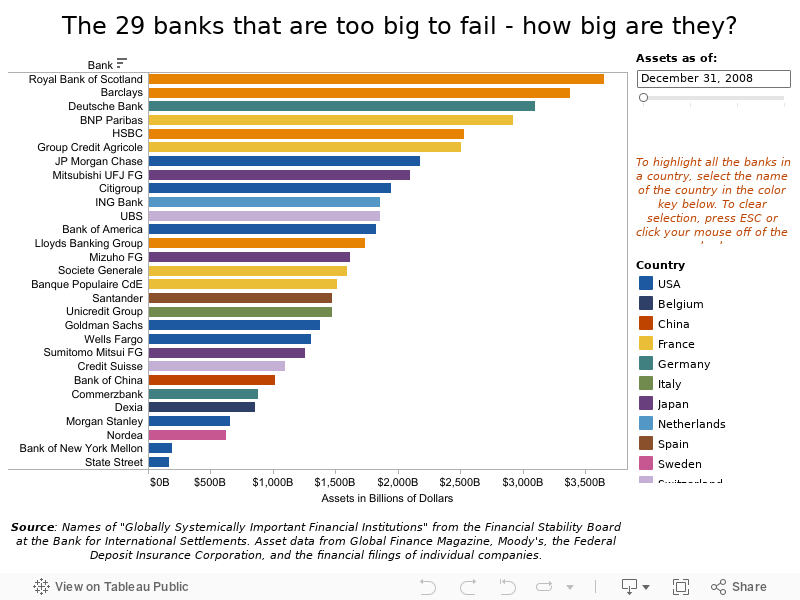
Nov. 16, 2011 — After three years of deliberations, the Financial Stability Board at the Bank of International Settlements recently released the names of 29 financial institutions it had deemed to be “globally systemically important.” Eight of those banks are in the United States, and their names are familiar.
Using data that had already been collected by Global Finance Magazine, as well as other data from the Federal Deposit Insurance Corporation, Moody’s, and the financial reports of individual companies, the data visualization below shows how big each bank (as measured by total assets) was at the end of 2008, 2009, and 2010, as well as at the end of June of this year. (Assets are shown in billions of dollars: for example, $3,650B represents $3,650,000,000,000 or $3.65 trillion).
It turns out that most of the banks are bigger than they were in 2008.
To move through the years, use the slider in the upper right-hand corner of the visualization. To highlight all the “too big to fail” banks in a country, select the country on the color code on the right.
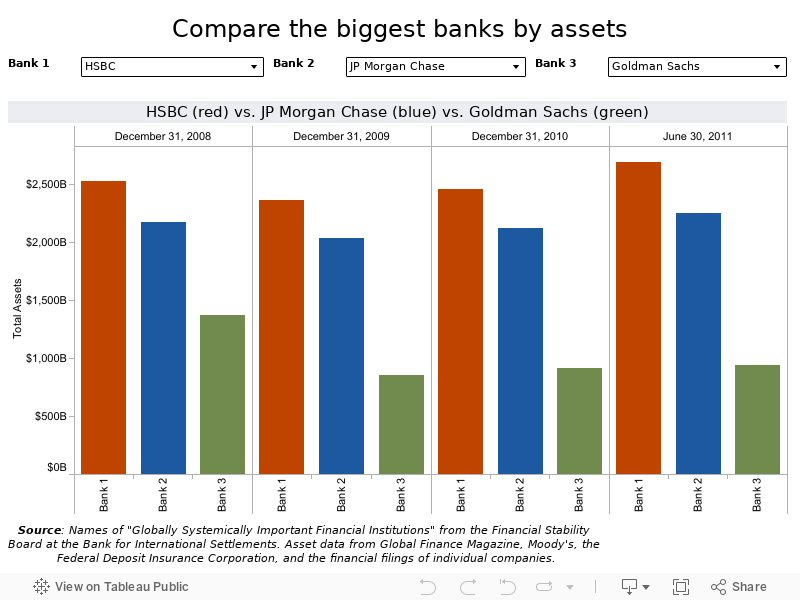
Using the same data, the visualization on this page allows you to compare any three of the systemically important banks over time. Using the drop-down windows at the top of the visualization, choose the names of each bank you would like to compare.
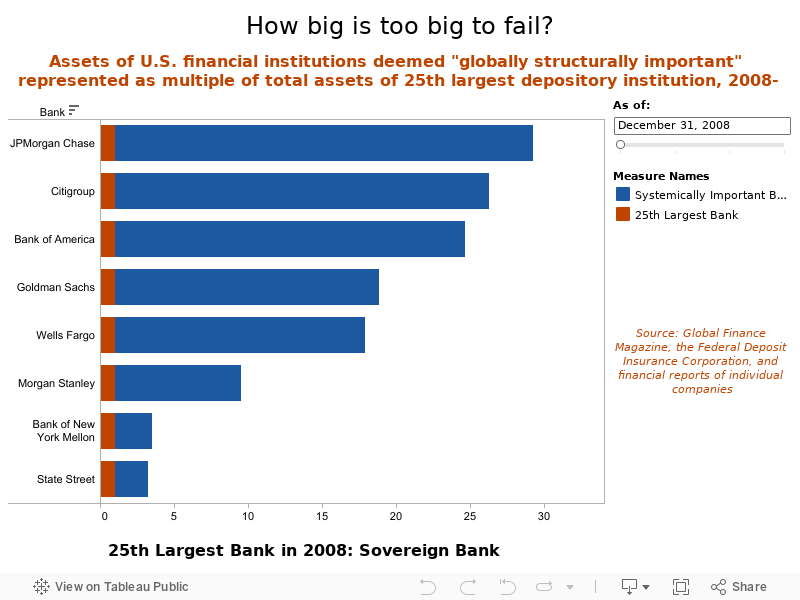
In this visualization, the total assets of the eight systemically important U.S. banks are represented as a multiple of the total assets of the 25th largest depositary institution for the year being displayed. Data can be shown for any year from 2008 to 2011. For example, in 2008, Bank of America was 23.65 times larger than Sovereign Bank, then the 25th largest bank in the U.S. At the end of 2010, it was 31.42 times larger than that year’s 25th largest bank, Capital One. To move through the years, use the slider in the upper right-hand corner of the visualization.