Aug. 7, 2013 — While the unemployment rate is by far the most commonly cited labor force statistic, it provides a limited picture. It omits people who are underemployed in one of three ways: (1) people who want to be working full-time but who are working part-time because they are unable to find full-time work; (2) discouraged workers (those who, when asked why they had not searched for work in the prior month, gave the specific reason that they believed no jobs were available for them); and (3) other marginally attached workers (those who had looked for work during the previous year — but not in the previous month — and who gave a reason for not looking recently other than the belief that no jobs were available).
These data visualizations, using data from “Alternative Measures of Labor Force Underutilization for States” produced by the Bureau of Labor Statistics, shows the average annual percentage of the civilian labor force that falls into each of four categories of unemployment and underemployment in each of the 50 states for the years 2003 to 2012.
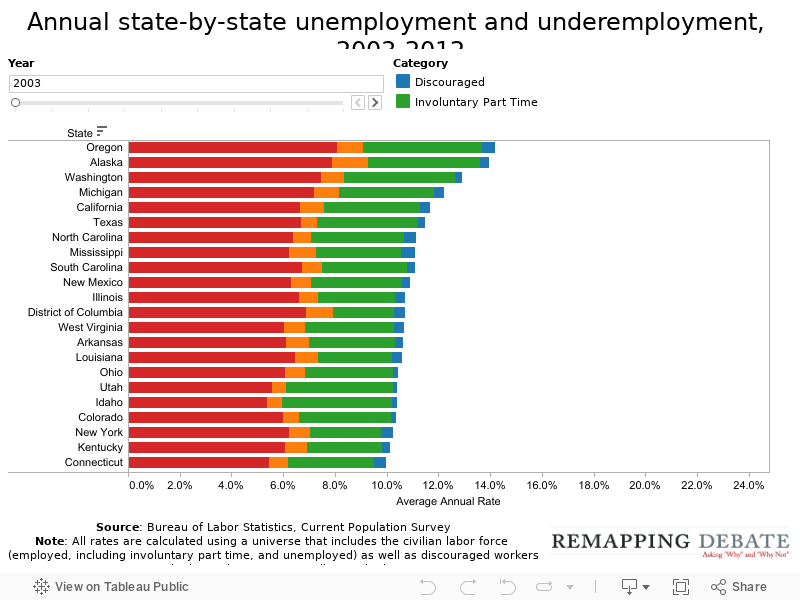
The first chart ranks states based on the aggregate of unemployment, forced part-time work, discouraged workers, and other marginally attached workers (visualizing each sub-component). To see how the rates and rankings change over time, move the slider in the upper left-hand side of the visualization through the years.
In 2012, 23 states still clocked in with an combined unemployment and underemployment rate of 14 percent or more. That compares with only two states in 2003.
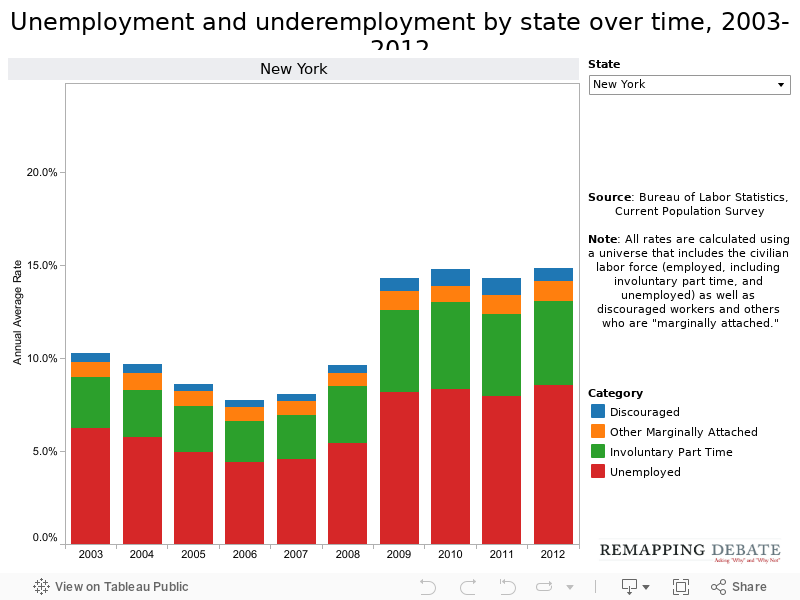
The chart on the next page allows you to select a state and see how that state changes over time.
Additional research: Michelle Mayer
This chart enables a quick view of how unemployment and underemployment within a state has changed over time. Simply choose a state in the upper right-hand corner of the visualization to see how the rates have changed.
Drops in underemployment do not necessarily follow drops in unemployment. Take Virginia, for example. Its unemployment rate in 2012 was down from its 2010 level (dropping to 5.9 percent from 7.4 percent), but it’s underemployment rate was up (to 5.9 percent from 5.6 percent).